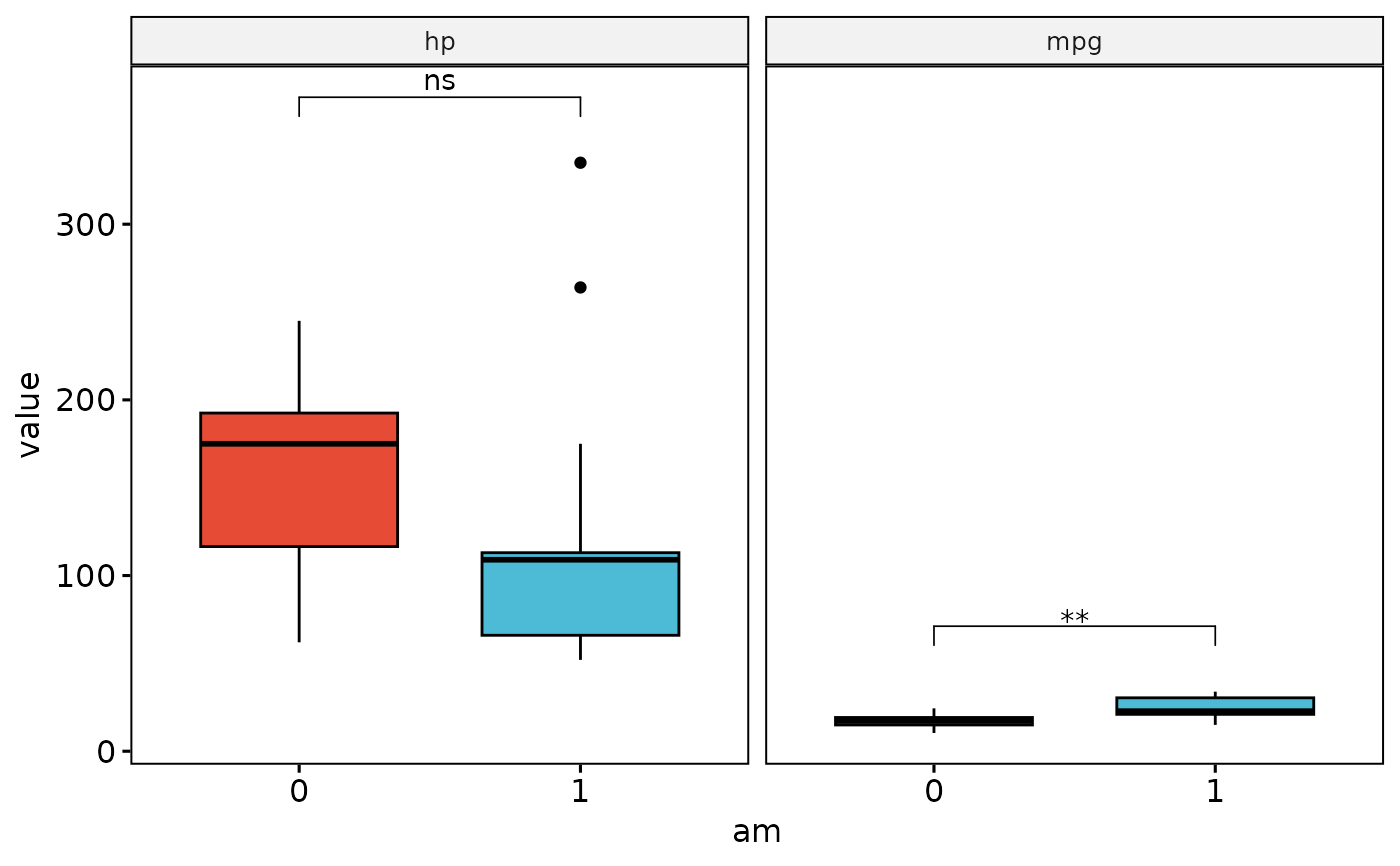
Code for this function is based on the Guide of A. Kassambra on datanovia The functions creates given a vector of dependent variables (DV), nicely formatted boxplots with facetwrap for all DVs and calculates an independent sample T-Test to include significance bars
Usage
boxplot_t_test(df, dependentvars, group, adjust_p = "BH", ylimits = c(0, 150))Arguments
- df
data.frame.
- dependentvars
Character vector.
- group
Character vector.
- adjust_p
Character vector. "holm", "hochberg", "hommel", "bonferroni", "BH", "BY", "fdr", "none". See
adjust_pvaluefor more details- ylimits
Numeric vector.
Examples
boxplot_t_test(mtcars, c("mpg", "hp"), group = "am")
#> $am
#> $am$plot
 #>
#> $am$stats
#> # A tibble: 2 × 15
#> variab…¹ .y. group1 group2 n1 n2 stati…² df p p.adj p.adj…³
#> <chr> <chr> <chr> <chr> <int> <int> <dbl> <dbl> <dbl> <dbl> <chr>
#> 1 hp value 0 1 19 13 1.27 18.7 0.221 0.221 ns
#> 2 mpg value 0 1 19 13 -3.77 18.3 0.00137 0.00274 **
#> # … with 4 more variables: y.position <dbl>, groups <named list>, xmin <dbl>,
#> # xmax <dbl>, and abbreviated variable names ¹variables, ²statistic,
#> # ³p.adj.signif
#>
#>
#>
#> $am$stats
#> # A tibble: 2 × 15
#> variab…¹ .y. group1 group2 n1 n2 stati…² df p p.adj p.adj…³
#> <chr> <chr> <chr> <chr> <int> <int> <dbl> <dbl> <dbl> <dbl> <chr>
#> 1 hp value 0 1 19 13 1.27 18.7 0.221 0.221 ns
#> 2 mpg value 0 1 19 13 -3.77 18.3 0.00137 0.00274 **
#> # … with 4 more variables: y.position <dbl>, groups <named list>, xmin <dbl>,
#> # xmax <dbl>, and abbreviated variable names ¹variables, ²statistic,
#> # ³p.adj.signif
#>
#>