Extracts Classification Metrics during CV in Caret and Creates a Table for Publication
Source:R/flex_caret_resample_metrics.R
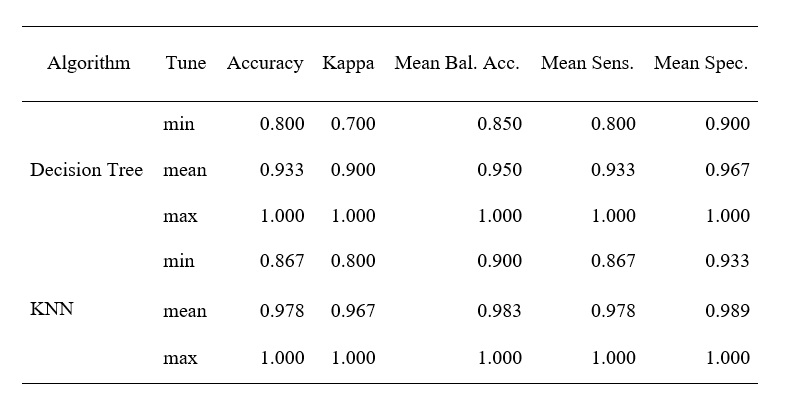
flex_resample_metrics.RdA convenience function, that extracts desired classification metrics
obtained during training (resampling, cross-validation), with caret,
summarizes them (default min, mean, max, for more options see
describe) and creates a
flextable object. The flextable is than formatted
for publication with the format_flextable function.
Arguments
- ls
A list containing the name of the algorithm as index, and the resamples extracted from caret e.g.
models <- list("Decision Tree" = decision_tree$resample, "KNN" = knn$resample))- nod
The number of decimals to show for each classification metric
- metrics
Metrics that should be extracted from the resamples of the trained caret model. Please note that if you want to have full flexibility of parameters to evaluate you should use the summaryFunction caret::multiClassSummary , in caret::trainControl function. Defaults to a selection taken of multiClassSummary:
metrics = c("Accuracy","Mean_Balanced_Accuracy", "Kappa", "logLoss", "Mean_Sensitivity", "Mean_Specificity" ).- descriptives
Summary stats that shall be calculated from the the resamples obtained in k-fold cross-validation training of a caret machine learning model. Summary stats utilize the
describefunction for calculation of summary. Per default the function extracts:descriptives = c("min", "mean", "max"). Other alternatives can be seen in the documentaiton ofdescribeand comprise, e.g., median, skew, kurtosis, se- ...
(Optional), Additional arguments. to be passed to
Value
A flextable object with APA ready table that
displays the performance metrics obtained during training with cross-validation